—Excel
Clean and delete in excel, I want to discuss the differences between the two, which makes me curious in my study.
First of all, clean, which works with the contents of a cell, based on data, including the formatting of the cell. The delete key on the keyboard is the shortcut key for its function, corresponding to the erase content function. There is also a shortcut key backspace delete key. Unlike delete, using the backspace key to clear will go into edit mode, and delete will not. The delete function is the action and cell, and the smallest scope is the cell.
Cell areas can be selected on their own, or you can use the default rows or columns. Even the removal of the entire worksheet. What I want to focus on here is that to initialize the content of a completed table, deleting cells is not a good choice to clear the content, and we should use all clear to complete the reservation of table Settings. In addition, all cleared content on the cell comment or borders, etc. should also be cleared, this is not done by keyboard shortcuts, so please try to use the menu operation.
Last year, I studied SPSS. One of the assignments is also about clearing data, and I think it has the same results as Excel.

—Pivot tables
Pivot tables can dynamically change their layout to analyze data in different ways, or they can rearrange row Numbers, columns, and page fields. Each time the layout is changed, the PivotTable immediately re-computes the data in accordance with the new layout. Alternatively, if the original data changes, the PivotTable can be updated. You can also combine mini graphs, functions
1. Organize and display data according to different latitudes; According to the different indicators analysis data, use a pivot table processing data, can be very convenient to do some operations using the function processing is very troublesome
2. PivotTable has very powerful data reorganization and data analysis ability. It can not only change the row and column layout of the data table but also can quickly summarize a large amount of data. It can also create data groups based on the original data table and summarize the established groups.
For data tables where each column has a column header, the PivotTable allows you to rotate rows or columns to see different summaries of the original data, display different types of data on different print pages, or show only the detailed data of the area of interest. In other words, the pivot table provides multi-angle data analysis information by rearranging the rows and columns of the source table. Perspective is to find the connection between a large number of seemingly unrelated data so as to transform random data into useful information.

—Wrangler
Wrangling includes three parts: data collection, data assessment, data cleaning. There are many ways to collect data. The simplest and most common is to download ready-made data. But for scalability and repeatability, you sometimes need to download it programmatically. For example, there are hundreds or thousands of files that need to be downloaded, even on different pages. Data assessment can be done in two ways: quality, cleanliness. The quality of Low-quality data is often referred to as dirty data, for example:
- data loss, missing values.
- the data is invalid.
- data inaccuracy.
- data inconsistencies, such as using different length units (inches and centimeters).
Tidiness
Messy data, often called messy data, is a concept pioneered by statisticians
Clean
Divided into manual cleaning and procedural cleaning.
Program cleaning:
These definitions also serve as an instruction list so others (or yourself in the future) can look at your work and reproduce it.
Convert those definitions to Code and run that Code.
Reassess and Iterate
After cleaning, always reassess and iterate on any of the data wrangling steps if necessary.
Store (Optional)
Store data, in a file or database for example, if you need to use it in the future
—Reading
The truthful art/ part 3 functional / cha 5- 9
Try to use different graphic forms in your reports based on the target you want to share with your customer.
To be specific,
A scatter diagram
The scatterplot is not commonly used in reports, but it can be calculated with the highest image rate in data analysis. The scatter diagram represents the relationship between two variables by means of coordinate axes. Drawing it depends on the distribution of a large number of data points.
The advantage of scatterplot is to reveal the relationship between data and discover the correlation between variables.
The scatter diagram needs two numerical dimensions to represent the X-axis and Y-axis, and the following example is height and weight.
Bar charts
A bar chart is one of the most commonly used charts by analysts and is often used to compare and vary multiple dimensions.
The text dimension/time dimension is usually used as the X-axis. The numerical dimension serves as the Y-axis. A histogram requires at least one numerical dimension.
The figure below is a comparative analysis of the histogram, using color to distinguish the categories. When there are too many dimensions to compare, the bar chart is inadequate.
Geographic map
All analysis related to spatial attributes can be applied to geographical maps. For example, the sales volume in each region, or the store density in a commercial area.
Geographic maps must use coordinate dimensions. It could be longitude and latitude, or it could be geographical. Coordinates can be as small as a street or as broad as any country in the world.
The pie chart
Pie charts often show the proportion of a group of data. You can use a fan, ring, or multiple ring nesting. There are many applications in business reporting. To represent proportions, the puzzle needs numerical dimensions. Pie charts are flawed because they are good at expressing a large category. But not good at the contrast. Thirty percent and thirty-five percent are indistinguishable to the naked eye on a pie chart. When there are too many categories, they are not suitable to be expressed on the pie chart.
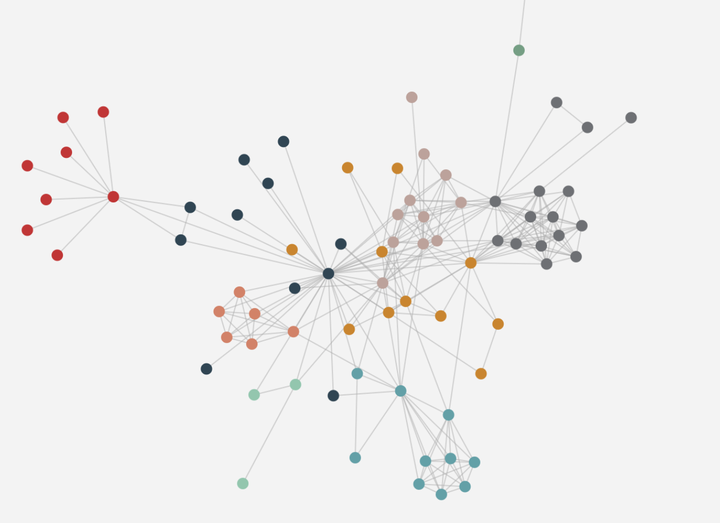
The diagram can show the relationship of items
A chart showing the relevance and relevance of things, such as the chain of social relationships, brand communication, or the flow of certain information.
—Pivot tables


Comments
Post a Comment